The 76th round of the Reserve Bank of India’s Industrial Outlook Survey (IOS) indicated a decline in business sentiments. This round of the survey was conducted during October-December 2016. The survey elicited response from 1221 manufacturing companies. The survey provides qualitative assessment of business situation of companies in the Indian manufacturing sector for Q3:2016-17 and their expectations for the ensuing quarter Q4:2016-17. Results of 75th round (Q2:2016-17) of the survey were released on October 4, 2016 on the RBI website.
The survey responses are those of the respondents and are not necessarily shared by the Reserve Bank of India.
Highlights:
Assessment for Q3:2016-17
The survey indicated slight moderation in the sentiments in demand condition for the second successive quarter. In respect of several parameters like order books, capacity utilisation and imports, the level of optimism was lower in this quarter than Q2:2016-17. However, the respondents were somewhat more optimistic about the export performance than Q2:2016-17 while the optimism on production remained unchanged.
Availability of finance from banks and other sources were perceived to have worsened. However, due to reduced pessimism about the cost of finance and the cost of raw material, the sentiment on profit margin remained largely unchanged.
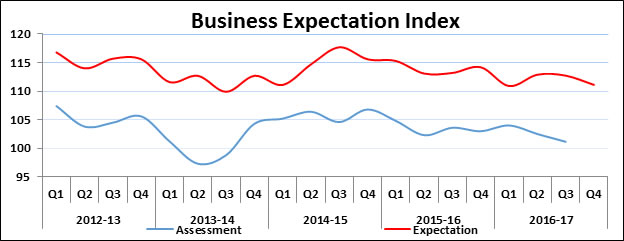
Overall, the business sentiments of the Indian manufacturing sector, as inferred from the Business Expectation Index (BEI), deteriorated for the second successive quarter.
Expectation for Q4: 2016-17
The outlook on business sentiments in Q4: 2016-17 largely followed similar pattern. However, in respect of demand condition (Order Books, Production), the outlook deteriorated. Pressure from rise in cost of raw material was expected to bring down profit margin. Improved sentiments were expressed in pending orders, exports, and cost of finance.
The summary index BEI declined from the Q3: 2016-17 level.
Summary Table
Net response1 (in %) comparison over previous quarter |
| Parameters |
Assessment period |
Expectation period |
| Q2:2016-17 |
Q3:2016-17 |
Q3:2016-17 |
Q4:2016-17 |
| Production |
10.8 |
10.8 |
28.9 |
27.8 |
| Order Books |
9.0 |
7.1 |
24.7 |
20.9 |
| Pending Orders |
13.7 |
13.7 |
6.2 |
10.3 |
| Capacity Utilisation |
3.6 |
2.3 |
17.2 |
16.4 |
| Exports |
-0.8 |
4.4 |
11.2 |
12.1 |
| Imports |
7.0 |
6.2 |
8.7 |
8.4 |
| Employment |
6.8 |
3.8 |
9.1 |
5.2 |
| Financial Situation |
16.4 |
11.9 |
27.1 |
24.6 |
| Availability of Finance (from internal accruals) |
12.5 |
9.9 |
20.2 |
17.4 |
| Cost of Finance |
-7.9 |
-3.2 |
-7.5 |
-0.3 |
| Cost of Raw Material |
-39.0 |
-38.2 |
-32.0 |
-34.3 |
| Selling Price |
2.0 |
0.7 |
6.8 |
5.9 |
| Profit Margin |
-12.9 |
-13.0 |
0.1 |
-2.8 |
| Overall Business Situation |
17.4 |
13.0 |
31.3 |
27.9 |
| Salary |
32.8 |
26.1 |
24.7 |
21.7 |
| Business Expectation Index2 |
102.7 |
101.1 |
112.9 |
111.1 |
Alpana Killawala
Principal Adviser
Press Release : 2016-2017/2001
| Table 1: Assessment & Expectation for Production |
| (Percentage responses)@ |
| Quarter |
Total response |
Assessment |
Expectation |
| Increase |
Decrease |
No change |
Net response# |
Increase |
Decrease |
No change |
Net response |
| Q3:2015-16 |
1337 |
34.2 |
18.2 |
47.6 |
16.0 |
40.5 |
11.3 |
48.2 |
29.2 |
| Q4:2015-16 |
1342 |
35.6 |
18.8 |
45.6 |
16.8 |
41.2 |
10.2 |
48.6 |
31.1 |
| Q1:2016-17 |
1275 |
34.5 |
17.2 |
48.3 |
17.3 |
38.8 |
13.8 |
47.4 |
25.0 |
| Q2:2016-17 |
723 |
31.4 |
20.6 |
48.0 |
10.8 |
40.2 |
11.2 |
48.6 |
29.0 |
| Q3:2016-17 |
1221 |
32.0 |
21.2 |
46.8 |
10.8 |
40.9 |
12.0 |
47.2 |
28.9 |
| |
|
|
|
|
|
41.1 |
13.3 |
45.6 |
27.8 |
‘Increase’ in production is optimistic.
@: Due to rounding off percentage may not add up to 100. This is applicable for all the tables from 1 to 17.
#: Net Response (NR) is the difference of percentage of the respondents reporting optimism and that reporting pessimism. The range is -100 to 100. Any value greater than zero indicates expansion and any value less than zero indicates contraction. |
| Table 2: Assessment & Expectation for Order Books |
| (Percentage responses) |
| Quarter |
Total response |
Assessment |
Expectation |
| Increase |
Decrease |
No change |
Net response |
Increase |
Decrease |
No change |
Net response |
| Q3:2015-16 |
1337 |
30.4 |
18.8 |
50.8 |
11.5 |
37.4 |
11.9 |
50.8 |
25.5 |
| Q4:2015-16 |
1342 |
31.8 |
19.7 |
48.5 |
12.1 |
39.7 |
10.6 |
49.8 |
29.1 |
| Q1:2016-17 |
1275 |
32.1 |
16.5 |
51.3 |
15.6 |
35.5 |
14.3 |
50.3 |
21.2 |
| Q2:2016-17 |
723 |
29.3 |
20.4 |
50.3 |
9.0 |
38.1 |
10.8 |
51.1 |
27.3 |
| Q3:2016-17 |
1221 |
29.1 |
22.0 |
48.9 |
7.1 |
36.4 |
11.7 |
51.9 |
24.7 |
| |
|
|
|
|
|
35.1 |
14.2 |
50.7 |
20.9 |
| ‘Increase’ in order books is optimistic. |
| Table 3: Assessment & Expectation for Pending Orders |
| (Percentage responses) |
| Quarter |
Total response |
Assessment |
Expectation |
| Below Normal |
Above Normal |
Normal |
Net response |
Below Normal |
Above Normal |
Normal |
Net response |
| Q3:2015-16 |
1337 |
19.2 |
5.0 |
75.8 |
14.3 |
14.1 |
6.5 |
79.4 |
7.6 |
| Q4:2015-16 |
1342 |
18.2 |
4.3 |
77.4 |
13.9 |
13.3 |
7.0 |
79.7 |
6.3 |
| Q1:2016-17 |
1275 |
16.7 |
5.7 |
77.6 |
11.0 |
15.1 |
4.9 |
80.0 |
10.2 |
| Q2:2016-17 |
723 |
18.9 |
5.2 |
75.9 |
13.7 |
12.9 |
6.3 |
80.8 |
6.6 |
| Q3:2016-17 |
1221 |
19.0 |
5.3 |
75.7 |
13.7 |
12.9 |
6.7 |
80.4 |
6.2 |
| |
|
|
|
|
|
15.3 |
5.0 |
79.7 |
10.3 |
| Pending orders ‘Below Normal’ is optimistic. |
| Table 4: Assessment & Expectation for Capacity Utilisation |
| (Percentage responses) |
| Indicator |
Options |
Assessment |
Expectation |
| Q3:2015-16 |
Q4:2015-16 |
Q1:2016-17 |
Q2:2016-17 |
Q3:2016-17 |
Q4:2015-16 |
Q1:2016-17 |
Q2:2016-17 |
Q3:2016-17 |
Q4:2016-17 |
| Capacity Utilisation (CU)-(main product) |
Increase |
23.4 |
24.6 |
21.8 |
21.5 |
20.2 |
27.8 |
26.3 |
26.5 |
27.4 |
27.6 |
| No Change |
60.4 |
57.9 |
63.1 |
60.7 |
61.9 |
63.5 |
60.8 |
63.9 |
62.5 |
61.2 |
| Decrease |
16.3 |
17.5 |
15.1 |
17.9 |
17.9 |
8.7 |
12.9 |
9.7 |
10.2 |
11.2 |
| Net Response |
7.1 |
7.1 |
6.7 |
3.6 |
2.3 |
19.1 |
13.4 |
16.8 |
17.2 |
16.4 |
| Level of CU (compared to the average in last 4 quarters) |
Above normal |
8.7 |
9.8 |
10.9 |
9.3 |
8.7 |
9.4 |
9.8 |
10.3 |
10.8 |
10.6 |
| Normal |
72.6 |
71.0 |
72.5 |
75.3 |
74.9 |
78.2 |
75.6 |
77.8 |
77.7 |
76.5 |
| Below Normal |
18.6 |
19.2 |
16.6 |
15.4 |
16.4 |
12.4 |
14.6 |
11.9 |
11.5 |
12.9 |
| Net Response |
-9.9 |
-9.4 |
-5.7 |
-6.0 |
-7.7 |
-3.0 |
-4.8 |
-1.6 |
-0.7 |
-2.3 |
| Assessment of Prod. Capacity (with regard to expected demand in next 6 months) |
More than adequate |
14.3 |
13.9 |
14.6 |
14.4 |
12.3 |
14.5 |
13.8 |
13.6 |
14.2 |
11.9 |
| Adequate |
77.2 |
77.7 |
76.8 |
77.3 |
78.6 |
78.5 |
79.1 |
78.8 |
78.4 |
80.7 |
| Less than adequate |
8.5 |
8.5 |
8.6 |
8.2 |
9.1 |
7.0 |
7.1 |
7.6 |
7.4 |
7.4 |
| Net Response |
5.8 |
5.4 |
6.0 |
6.2 |
3.2 |
7.5 |
6.7 |
6.0 |
6.8 |
4.5 |
| ‘Increase’ in capacity utilisation is optimistic. |
| Table 5: Assessment & Expectation for Exports |
| (Percentage responses) |
| Quarter |
Total response |
Assessment |
Expectation |
| Increase |
Decrease |
No change |
Net response |
Increase |
Decrease |
No change |
Net response |
| Q3:2015-16 |
1337 |
23.3 |
17.7 |
59.0 |
5.7 |
27.3 |
10.6 |
62.1 |
16.7 |
| Q4:2015-16 |
1342 |
22.1 |
18.8 |
59.1 |
3.3 |
26.9 |
10.0 |
63.1 |
16.9 |
| Q1:2016-17 |
1275 |
21.5 |
15.3 |
63.1 |
6.2 |
25.7 |
12.0 |
62.3 |
13.7 |
| Q2:2016-17 |
723 |
19.8 |
20.6 |
59.6 |
-0.8 |
26.3 |
9.5 |
64.2 |
16.8 |
| Q3:2016-17 |
1221 |
22.9 |
18.5 |
58.6 |
4.4 |
24.3 |
13.2 |
62.5 |
11.2 |
| |
|
|
|
|
|
25.3 |
13.2 |
61.5 |
12.1 |
| ‘Increase’ in exports is optimistic. |
| Table 6: Assessment & Expectation for Imports |
| (Percentage responses) |
| Quarter |
Total response |
Assessment |
Expectation |
| Increase |
Decrease |
No change |
Net response |
Increase |
Decrease |
No change |
Net response |
| Q3:2015-16 |
1337 |
17.2 |
11.1 |
71.8 |
6.1 |
18.0 |
8.8 |
73.2 |
9.2 |
| Q4:2015-16 |
1342 |
17.6 |
12.9 |
69.4 |
4.7 |
16.4 |
8.6 |
75.0 |
7.7 |
| Q1:2016-17 |
1275 |
18.1 |
9.7 |
72.3 |
8.4 |
16.7 |
10.9 |
72.4 |
5.8 |
| Q2:2016-17 |
723 |
17.5 |
10.6 |
71.9 |
7.0 |
17.5 |
7.9 |
74.6 |
9.6 |
| Q3:2016-17 |
1221 |
17.9 |
11.7 |
70.4 |
6.2 |
18.1 |
9.4 |
72.5 |
8.7 |
| |
|
|
|
|
|
17.7 |
9.3 |
73.1 |
8.4 |
| Increase’ in imports is optimistic. |
| Table 7: Assessment & Expectations for level of Inventory (Raw Material and Finished Goods) |
| (Percentage responses) |
| Indicator |
Options |
Assessment |
Expectation |
| Q3:20 15-16 |
Q4:20 15-16 |
Q1:20 16-17 |
Q2:20 16-17 |
Q3:20 16-17 |
Q4:20 15-16 |
Q1:20 16-17 |
Q2:20 16-17 |
Q3:20 16-17 |
Q4:20 16-17 |
| Inventory of raw material |
Below average |
6.5 |
7.0 |
6.0 |
7.0 |
7.3 |
5.3 |
5.9 |
5.8 |
5.2 |
6.8 |
| Average |
81.4 |
80.5 |
81.7 |
81.2 |
81.1 |
84.8 |
84.4 |
83.5 |
84.5 |
84.2 |
| Above average |
12.2 |
12.5 |
12.4 |
11.8 |
11.7 |
9.9 |
9.7 |
10.8 |
10.3 |
9.0 |
| Net Response |
-5.7 |
-5.5 |
-6.4 |
-4.8 |
-4.4 |
-4.7 |
-3.8 |
-5.0 |
-5.2 |
-2.2 |
| Inventory of finished goods |
Below average |
7.0 |
8.7 |
7.0 |
6.7 |
6.4 |
6.2 |
7.0 |
7.1 |
4.5 |
6.5 |
| Average |
75.7 |
75.9 |
77.7 |
77.5 |
78.3 |
81.6 |
81.9 |
80.8 |
83.0 |
81.9 |
| Above average |
17.4 |
15.4 |
15.3 |
15.8 |
15.3 |
12.1 |
11.1 |
12.1 |
12.5 |
11.6 |
| Net Response |
-10.4 |
-6.7 |
-8.3 |
-9.0 |
-8.9 |
-5.9 |
-4.1 |
-5.0 |
-7.9 |
-5.1 |
| Inventory of raw material and finished goods ‘Below average’ is optimistic. |
| Table 8: Assessment & Expectations for Employment Outlook |
| (Percentage responses) |
| Quarter |
Total response |
Assessment |
Expectation |
| Increase |
Decrease |
No change |
Net response |
Increase |
Decrease |
No change |
Net response |
| Q3:2015-16 |
1337 |
15.3 |
9.4 |
75.3 |
5.8 |
15.7 |
6.1 |
78.2 |
9.6 |
| Q4:2015-16 |
1342 |
14.2 |
10.1 |
75.7 |
4.1 |
15.3 |
6.7 |
78.0 |
8.6 |
| Q1:2016-17 |
1275 |
15.0 |
9.7 |
75.3 |
5.3 |
15.1 |
8.0 |
76.9 |
7.1 |
| Q2:2016-17 |
723 |
14.5 |
7.7 |
77.8 |
6.8 |
15.8 |
7.7 |
76.5 |
8.1 |
| Q3:2016-17 |
1221 |
13.5 |
9.7 |
76.8 |
3.8 |
14.7 |
5.6 |
79.7 |
9.1 |
| |
|
|
|
|
|
12.1 |
6.9 |
81.0 |
5.2 |
| ‘Increase’ in employment is optimistic. |
| Table 9: Assessment & Expectation for Overall Financial Situation |
| (Percentage responses) |
| Quarter |
Total response |
Assessment |
Expectation |
| Better |
Worsen |
No change |
Net response |
Better |
Worsen |
No change |
Net response |
| Q3:2015-16 |
1337 |
26.2 |
12.9 |
60.9 |
13.2 |
34.8 |
8.8 |
56.4 |
26.0 |
| Q4:2015-16 |
1342 |
26.6 |
12.3 |
61.0 |
14.3 |
33.3 |
8.5 |
58.2 |
24.7 |
| Q1:2016-17 |
1275 |
27.9 |
11.9 |
60.1 |
16.0 |
33.1 |
8.3 |
58.6 |
24.8 |
| Q2:2016-17 |
723 |
27.7 |
11.3 |
61.1 |
16.4 |
35.2 |
8.3 |
56.5 |
26.9 |
| Q3:2016-17 |
1221 |
26.0 |
14.1 |
59.9 |
11.9 |
33.9 |
6.8 |
59.3 |
27.1 |
| |
|
|
|
|
|
34.1 |
9.5 |
56.4 |
24.6 |
| ‘Better’ overall financial situation is optimistic. |
| Table 10: Assessment & Expectation for Working Capital Finance Requirement |
| (Percentage responses) |
| Quarter |
Total response |
Assessment |
Expectation |
| Increase |
Decrease |
No change |
Net response |
Increase |
Decrease |
No change |
Net response |
| Q3:2015-16 |
1337 |
30.3 |
6.7 |
62.9 |
23.6 |
29.9 |
4.3 |
65.8 |
25.5 |
| Q4:2015-16 |
1342 |
31.7 |
6.8 |
61.4 |
24.9 |
30.1 |
4.9 |
65.0 |
25.2 |
| Q1:2016-17 |
1275 |
28.1 |
7.2 |
64.7 |
20.8 |
30.0 |
5.4 |
64.6 |
24.6 |
| Q2:2016-17 |
723 |
26.0 |
6.6 |
67.4 |
19.4 |
29.7 |
5.6 |
64.7 |
24.1 |
| Q3:2016-17 |
1221 |
28.9 |
6.9 |
64.3 |
22.0 |
28.1 |
4.1 |
67.8 |
24.1 |
| |
|
|
|
|
|
29.2 |
5.3 |
65.5 |
23.9 |
| ‘Increase’ in working capital finance is optimistic. |
| Table 11: Assessment & Expectation for Availability of Finance |
| (Percentage responses) |
| Indicator |
Options |
Assessment |
Expectation |
| Q3:2015-16 |
Q4:2015-16 |
Q1:2016-17 |
Q2:2016-17 |
Q3:2016-17 |
Q4:2015-16 |
Q1:20 16-17 |
Q2:20 16-17 |
Q3:20 16-17 |
Q4:20 16-17 |
| Availability of finance (from internal accruals) |
Improve |
22.3 |
21.7 |
22.4 |
21.0 |
21.6 |
26.1 |
25.6 |
25.9 |
25.2 |
25.4 |
| No Change |
68.3 |
69.0 |
68.6 |
70.5 |
66.7 |
67.8 |
68.3 |
68.3 |
69.8 |
66.6 |
| Worsen |
9.4 |
9.3 |
8.9 |
8.5 |
11.7 |
6.1 |
6.1 |
5.8 |
5.0 |
8.0 |
| Net Response |
12.9 |
12.4 |
13.5 |
12.5 |
9.9 |
20.0 |
19.5 |
20.1 |
20.2 |
17.4 |
| Availability of Finance (from banks & other sources) |
Improve |
19.2 |
18.3 |
18.7 |
18.3 |
19.6 |
20.6 |
21.6 |
21.7 |
21.8 |
22.5 |
| No Change |
74.4 |
74.2 |
73.6 |
76.1 |
72.5 |
74.7 |
73.2 |
72.7 |
74.9 |
71.9 |
| Worsen |
6.3 |
7.5 |
7.7 |
5.6 |
7.9 |
4.7 |
5.2 |
5.5 |
3.3 |
5.6 |
| Net Response |
12.9 |
10.8 |
11.0 |
12.7 |
11.7 |
16.0 |
16.4 |
16.2 |
18.5 |
16.9 |
| Availability of Finance (from overseas, if applicable) |
Improve |
11.3 |
8.8 |
10.6 |
10.0 |
9.1 |
12.1 |
10.0 |
12.2 |
10.3 |
10.0 |
| No Change |
83.5 |
85.3 |
84.4 |
86.6 |
86.1 |
84.1 |
85.4 |
84.1 |
87.7 |
86.5 |
| Worsen |
5.2 |
5.9 |
5.0 |
3.3 |
4.8 |
3.9 |
4.7 |
3.8 |
2.0 |
3.5 |
| Net Response |
6.2 |
2.9 |
5.6 |
6.7 |
4.3 |
8.2 |
5.3 |
8.4 |
8.3 |
6.5 |
| ‘Improvement’ in availability of finance is optimistic. |
| Table 12: Assessment & Expectation for Cost of Finance |
| (Percentage responses) |
| Quarter |
Total response |
Assessment |
Expectation |
| Decrease |
Increase |
No change |
Net response |
Decrease |
Increase |
No change |
Net response |
| Q3:2015-16 |
1337 |
14.0 |
19.4 |
66.6 |
-5.4 |
10.2 |
17.9 |
71.9 |
-7.6 |
| Q4:2015-16 |
1342 |
11.0 |
19.7 |
69.2 |
-8.7 |
10.5 |
15.9 |
73.6 |
-5.5 |
| Q1:2016-17 |
1275 |
10.1 |
19.9 |
70.0 |
-9.8 |
8.8 |
17.1 |
74.1 |
-8.3 |
| Q2:2016-17 |
723 |
9.4 |
17.3 |
73.3 |
-7.9 |
9.9 |
17.4 |
72.6 |
-7.5 |
| Q3:2016-17 |
1221 |
12.9 |
16.1 |
71.1 |
-3.2 |
9.4 |
16.9 |
73.8 |
-7.5 |
| |
|
|
|
|
|
14.5 |
14.8 |
70.8 |
-0.3 |
| Decrease’ in cost of finance is optimistic. |
| Table 13: Assessment & Expectation for Cost of Raw Material |
| (Percentage responses) |
| Quarter |
Total response |
Assessment |
Expectation |
| Decrease |
Increase |
No change |
Net response |
Decrease |
Increase |
No change |
Net response |
| Q3:2015-16 |
1337 |
12.4 |
38.7 |
48.9 |
-26.4 |
7.1 |
35.2 |
57.7 |
-28.1 |
| Q4:2015-16 |
1342 |
13.3 |
37.7 |
49.0 |
-24.4 |
6.9 |
34.2 |
58.9 |
-27.3 |
| Q1:2016-17 |
1275 |
7.5 |
41.5 |
51.0 |
-34.0 |
8.3 |
36.0 |
55.7 |
-27.7 |
| Q2:2016-17 |
723 |
4.2 |
43.1 |
52.7 |
-39.0 |
6.0 |
37.5 |
56.5 |
-31.5 |
| Q3:2016-17 |
1221 |
6.4 |
44.6 |
48.9 |
-38.2 |
5.5 |
37.4 |
57.1 |
-32.0 |
| |
|
|
|
|
|
5.1 |
39.4 |
55.6 |
-34.3 |
| ‘Decrease’ in cost of raw material is optimistic. |
| Table 14: Assessment & Expectation for Selling Price |
| (Percentage responses) |
| Quarter |
Total response |
Assessment |
Expectation |
| Increase |
Decrease |
No change |
Net response |
Increase |
Decrease |
No change |
Net response |
| Q3:2015-16 |
1337 |
16.7 |
18.0 |
65.3 |
-1.4 |
18.3 |
12.2 |
69.5 |
6.2 |
| Q4:2015-16 |
1342 |
15.9 |
19.6 |
64.5 |
-3.7 |
17.9 |
10.7 |
71.4 |
7.2 |
| Q1:2016-17 |
1275 |
18.9 |
13.2 |
67.9 |
5.7 |
20.2 |
13.1 |
66.7 |
7.1 |
| Q2:2016-17 |
723 |
16.5 |
14.5 |
69.0 |
2.0 |
19.8 |
9.7 |
70.5 |
10.1 |
| Q3:2016-17 |
1221 |
16.9 |
16.2 |
66.9 |
0.7 |
17.2 |
10.4 |
72.4 |
6.8 |
| |
|
|
|
|
|
16.8 |
10.9 |
72.3 |
5.9 |
| ‘Increase’ in selling price is optimistic. |
| Table 15: Assessment & Expectation for Profit Margin |
| (Percentage responses) |
| Quarter |
Total response |
Assessment |
Expectation |
| Increase |
Decrease |
No change |
Net response |
Increase |
Decrease |
No change |
Net response |
| Q3:2015-16 |
1337 |
14.3 |
29.5 |
56.2 |
-15.3 |
18.4 |
19.7 |
61.9 |
-1.3 |
| Q4:2015-16 |
1342 |
13.4 |
30.1 |
56.5 |
-16.7 |
18.1 |
20.1 |
61.8 |
-2.0 |
| Q1:2016-17 |
1275 |
14.4 |
27.4 |
58.2 |
-12.8 |
18.5 |
22.1 |
59.4 |
-3.6 |
| Q2:2016-17 |
723 |
15.8 |
28.8 |
55.4 |
-12.9 |
19.1 |
19.3 |
61.6 |
-0.2 |
| Q3:2016-17 |
1221 |
15.3 |
28.3 |
56.4 |
-13.0 |
19.5 |
19.4 |
61.2 |
0.1 |
| |
|
|
|
|
|
18.5 |
21.3 |
60.2 |
-2.8 |
| ‘Increase’ in profit margin is optimistic. |
| Table 16: Assessment & Expectation for Overall Business Situation |
| (Percentage responses) |
| Quarter |
Total response |
Assessment |
Expectation |
| Better |
Worsen |
No change |
Net response |
Better |
Worsen |
No change |
Net response |
| Q3:2015-16 |
1337 |
31.3 |
14.0 |
54.7 |
17.4 |
39.9 |
8.3 |
51.8 |
31.6 |
| Q4:2015-16 |
1342 |
30.8 |
14.6 |
54.6 |
16.2 |
40.9 |
7.6 |
51.5 |
33.3 |
| Q1:2016-17 |
1275 |
33.3 |
12.1 |
54.6 |
21.2 |
39.4 |
8.9 |
51.7 |
30.5 |
| Q2:2016-17 |
723 |
31.4 |
14.0 |
54.6 |
17.4 |
41.2 |
7.7 |
51.1 |
33.5 |
| Q3:2016-17 |
1221 |
29.4 |
16.4 |
54.2 |
13.0 |
40.1 |
8.7 |
51.2 |
31.3 |
| |
|
|
|
|
|
39.4 |
11.5 |
49.1 |
27.9 |
| ‘Better’ Overall Business Situation is optimistic. |
| Table 17: Assessment & Expectation for Salary/Other Remuneration |
| (Percentage responses) |
| Quarter |
Total response |
Assessment |
Expectation |
| Increase |
Decrease |
No change |
Net response |
Increase |
Decrease |
No change |
Net response |
| Q3:2015-16 |
1337 |
28.4 |
3.2 |
68.4 |
25.1 |
24.3 |
2.3 |
73.4 |
22.0 |
| Q4:2015-16 |
1342 |
30.5 |
3.0 |
66.5 |
27.5 |
25.0 |
2.8 |
72.2 |
22.1 |
| Q1:2016-17 |
1275 |
34.9 |
2.9 |
62.2 |
32.0 |
33.2 |
2.9 |
63.9 |
30.3 |
| Q2:2016-17 |
723 |
35.8 |
3.0 |
61.2 |
32.8 |
30.0 |
3.1 |
66.9 |
26.9 |
| Q3:2016-17 |
1221 |
28.9 |
2.8 |
68.3 |
26.1 |
26.6 |
2.0 |
71.4 |
24.7 |
| |
|
|
|
|
|
25.0 |
3.3 |
71.8 |
21.7 |
| ‘Increase in Salary / other remuneration’ is optimistic. |
| Table 18: Business Expectation Index (BEI) |
| Quarter |
BEI-Assessment Quarter |
BEI-Expectation Quarter |
| Q3:2015-16 |
103.6 |
113.4 |
| Q4:2015-16 |
103.0 |
114.2 |
| Q1:2016-17 |
104.0 |
110.9 |
| Q2:2016-17 |
102.7 |
112.9 |
| Q3:2016-17 |
101.1 |
112.9 |
| Q4:2016-17 |
|
111.1 |
1 Net Response (NR) is the difference of percentage of the respondents reporting optimism and that reporting pessimism. The range is -100 to 100. Any value greater than zero indicates expansion/optimism and any value less than zero indicates contraction/pessimism i.e., NR = (I – D); where, I is the percentage response of ‘Increase/optimism’, and D is the percentage response of ‘Decrease/pessimism’ and E is the percentage response as ‘no change/Equal’; I+D+E=100. For example, increase in production is optimism whereas decrease in cost of raw material is optimism.
2 The Business Expectation Index (BEI) is a composite indicator calculated as weighted (share of GVA of different industry group) net response of nine business indicators. The nine indicators considered for computation of BEI are: (1) overall business situation, (2) production, (3) order books, (4) inventory of raw material, (5) inventory of finished goods, (6) profit margin, (7) employment, (8) exports and (9) capacity utilisation. It gives a single snapshot of business outlook in every quarter. BEI lies between 0 to 200, and 100 is the threshold separating expansion from contraction.
|