The Order Books, Inventories and Capacity Utilisation Survey (OBICUS) captures actual data from the companies in the manufacturing sector. This round of OBICUS, which is the 31st round in the series, captures data for Q2:2015-16. In all, 1,104 manufacturing sector companies responded in this round of the survey. The analysis is based on the data on order books, inventory levels for raw materials & finished goods, and capacity utilisation, received from a common set of companies.
Highlights:
Capacity Utilisation (CU): At the aggregate level, CU recorded fractional decline in Q2:2015-16 over the previous quarter and stood at 70.6 per cent; it was also lower than the level during the same quarter of the previous year. There is broad co-movement between capacity utilisation and de-trended IIP manufacturing (Chart 1).
Order Books: The average new orders grew marginally in Q2:2015-16 from its level of previous quarter. However, it remained unchanged from its level a year ago (Chart 2).
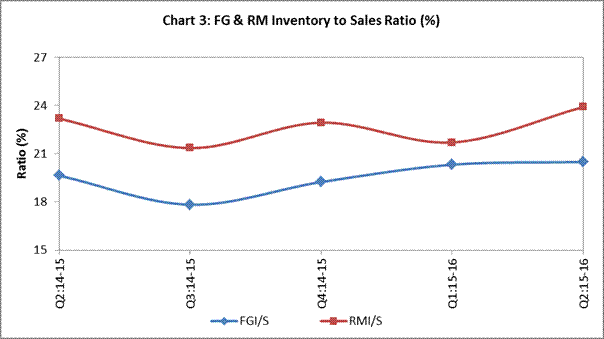
Inventory to Sales Ratio: The finished goods inventory to sales ratio (FGI/S) remained steady in Q2:2015-16. The raw material inventory to sales ratio (RMI/S) increased in Q2:2015-16 and stood at a higher level as compared to the level observed in Q2:2014-15 (Chart 3).
 ' '
Sangeeta Das
Director
Press Release : 2015-2016/1773
ANNEX
Table 1: IIP-Manufacturing and Capacity Utilization (CU) –
(Based on 949 common set of companies in 5 quarters) |
| Quarter |
IIP – Mfg
(Qtly avg Base 2004-05) |
De-trended Qtly IIP-Mfg |
CU
(in latest survey round) |
CU *
(Range from previous four survey rounds) |
| Q2:2014-15 |
179.2 |
-8.8 |
73.6 |
71.0 – 73.6 |
| Q3:2014-15 |
182.2 |
-6.4 |
71.3 |
70.7 – 72.0 |
| Q4:2014-15 |
201.2 |
11.9 |
73.6 |
74.1 – 75.2 |
| Q1:2015-16 |
188.4 |
-1.6 |
71.3 |
71.5 – 71.5 |
| Q2:2015-16 |
187.3 |
-3.4 |
70.6 |
NA # |
*: Since CU is being computed based on 5 quarter common set of companies, the CU for each round gets revised for subsequent four rounds.
#: CU is calculated first time for Q2:2015-16. |
Table 2: Order Books (Q2:2014-15 to Q2:2015-16) –
(Based on 373 common set of companies in 9 quarters) |
| Quarter |
Amount in ₹ Billion |
Q-o-Q growth (%) –
Seasonally not adjusted |
Y-o-Y Growth (%) |
| Avg Backlog order |
Avg New Order book |
Avg Pending order |
Avg Backlog order |
Avg New Order book |
Avg Pending order |
Avg Backlog order |
Avg New Order book |
Avg Pending order |
| Q2:2014-15 |
1.627 |
1.274 |
1.661 |
3.7 |
6.5 |
2.0 |
6.1 |
12.6 |
6.5 |
| Q3:2014-15 |
1.662 |
1.165 |
1.607 |
2.2 |
-8.5 |
-3.3 |
6.6 |
-8.4 |
-2.2 |
| Q4:2014-15 |
1.605 |
1.226 |
1.508 |
-3.4 |
5.2 |
-6.1 |
-2.5 |
-1.5 |
-7.3 |
| Q1:2015-16 |
1.502 |
1.237 |
1.569 |
-6.4 |
0.9 |
4.0 |
-4.3 |
3.4 |
-3.7 |
| Q2:2015-16 |
1.562 |
1.275 |
1.549 |
4.0 |
3.1 |
-1.3 |
-4.0 |
0.1 |
-6.7 |
Table 3: Average Sales and Inventories and their ratios (Q2:2014-15 to Q2:2015-16) –
(Based on 723 common set of companies in 5 quarters) |
| Quarter |
Amount in ₹ Billion |
Ratio in per cent |
| Avg Sales |
Avg Total Inv |
Avg FG Inv |
Avg WiP Inv |
Avg RM Inv |
Total Inv/Sales |
FG Inv/Sales |
RM Inv/Sales |
| Q2:2014-15 |
6.408 |
3.184 |
1.259 |
0.439 |
1.486 |
49.7 |
19.6 |
23.2 |
| Q3:2014-15 |
5.990 |
2.773 |
1.068 |
0.426 |
1.279 |
46.3 |
17.8 |
21.4 |
| Q4:2014-15 |
5.449 |
2.705 |
1.048 |
0.407 |
1.250 |
49.6 |
19.2 |
22.9 |
| Q1:2015-16 |
5.625 |
2.811 |
1.143 |
0.448 |
1.221 |
50.0 |
20.3 |
21.7 |
| Q2:2015-16 |
5.335 |
2.804 |
1.093 |
0.435 |
1.276 |
52.6 |
20.5 |
23.9 |
| RM - Raw Material; WiP - Work in progress; FG - Finished Goods; Inv – Inventory. |
|